How Much Does a Corner Line Actually Move Before Kickoff?
Ask anyone who prices football markets which line they sweat over and they will say the goal line. Corners are the market they get to on Tuesday. That difference shows up in the data: corner totals sit still for longer, then move in bigger steps, and they move for reasons you can usually name.
This is a look at what that actually looks like in the tick history, and — more usefully — how to measure it on your own fixtures rather than taking my word for it.
Why corners behave differently to goals
Three structural reasons, none of them mysterious.
Less money. A book reprices when the flow forces it to. Corner markets take a fraction of the volume of 1X2, so the flow arrives in lumps rather than a stream, and the price sits unchanged between lumps.
Coarser increments. A goal line moves in quarters — 2.5, 2.75, 3.0. Corner lines move in halves, 9.5 to 10. That means the smallest possible corner move is a larger statement about what the book now believes.
Later information. The single biggest input to a corner total is how the two sides will actually set up, which you don't know until the teams are announced. Goal expectations barely shift on a full-back swap; corner expectations can.
Put together: a corner line that moves is carrying more information per move than a goal line that moves. That is the case for watching it.
What "the line moved" actually means
Worth being precise, because two different things get called a move.
The line is the handicap itself — 9.5 corners. The price is what you get paid on either side of it, say 1.90 over and 1.90 under.
A book adjusts the price first. If money keeps coming, it eventually shifts the whole line. So:
- Price drifting from 1.90 to 1.80 on the over: money on the over, book leaning.
- Line going 9.5 to 10: the book has given up leaning and moved the goalposts.
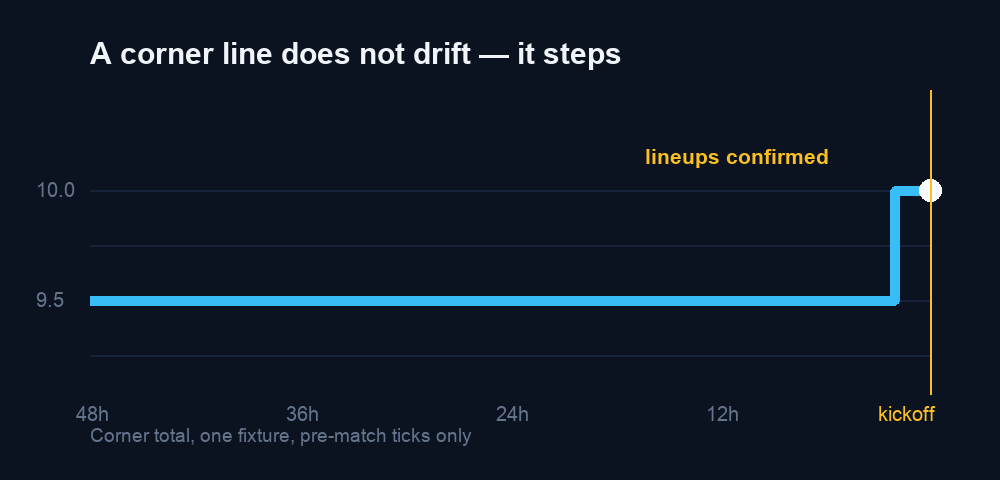
The second is rarer and means more. When you look at corner history, the line changes are the events worth marking — and plotted out, a corner line looks less like a drift and more like a staircase:
Measuring it yourself
Every price change the odds history endpoint returns carries a timestamp, the line, both prices, and the score at that moment. Pre-match ticks have a null minute, which is how you separate them from in-play.
from fivedollarfootball import Client

client = Client("fb_live_your_key")

ticks = list(client.iter_all(
    client.odds_history, fixture_id=FIXTURE_ID, market="corner"
))

prematch = [t for t in ticks if t["minute"] is None]
The question "did the line move" is then just counting distinct values:
lines = [t["line"] for t in prematch if t["line"] is not None]

if lines:
    print("opened at", lines[0])
    print("closed at", lines[-1])
    print("distinct lines:", sorted(set(lines)))
    print("times the line changed:",
          sum(1 for a, b in zip(lines, lines[1:]) if a != b))
A typical fixture gives you something like this — long stretches of one line, then a step:
opened at 9.5
closed at 10.0
distinct lines: [9.5, 10.0]
times the line changed: 1
Where the move happens
The interesting part is when. Line up the timestamps against kickoff and the changes cluster, rather than spreading evenly across the days a market is open.
from datetime import datetime, timezone

kickoff = datetime.fromisoformat(fixture["kickoff_utc"])

for a, b in zip(prematch, prematch[1:]):
    if a["line"] != b["line"]:
        moved = datetime.fromisoformat(b["recorded_at"])
        hours = (kickoff - moved).total_seconds() / 3600
        print(f"{a['line']} → {b['line']}  {hours:.1f}h before kickoff")
Run that across a set of fixtures and the pattern that shows up is a cluster in the last couple of hours — which is exactly when confirmed lineups land. That is the mechanism, and it is why a corner line is worth watching in a way a snapshot can never show you.
Doing this across a season
One fixture is an anecdote. The shape of the thing only appears in aggregate, and the aggregation is a loop:
season = client.league_fixtures(LEAGUE_ID, season="26/27")

moved, flat = 0, 0
for fixture in season:
    ticks = list(client.iter_all(
        client.odds_history, fixture_id=fixture["id"], market="corner"
    ))
    lines = [t["line"] for t in ticks if t["minute"] is None and t["line"] is not None]
    if len(set(lines)) > 1:
        moved += 1
    elif lines:
        flat += 1

print(f"line moved on {moved} of {moved + flat} fixtures")
Two honest warnings before you run that.
It is a lot of requests — one per fixture, and a full season is several hundred. Watch your rate limit and cache what you pull; the history for a finished match never changes, so there is no reason to fetch it twice.
And the answer you get is specific to the league and the bookmaker you asked about. A corner line in a heavily traded league behaves differently to one in a division the book prices off a model and forgets about. Aggregating across leagues will average away the thing you were trying to see.
What this is good for
Not tips. The useful output is a measurement: if you have a view on corners, was your number better than the one the market closed at? That is closing line value, and it is the only feedback loop short enough to learn from — results take a season to say anything, closing lines tell you within hours.
Corner markets are where a modest edge is most likely to survive, precisely because they get the least attention. Being able to see the whole price path is what lets you check whether yours does.
The tick history used above is on the Ultra plan, since storing every price change for every market is the expensive part of running this. Fixtures, live scores and corner-count league tables are on the free tier, no card.
If you would rather work in a spreadsheet than in Python, the same data goes into Google Sheets with a bit of Apps Script.