What Is the First Goal Worth? Every Premier League Price Move in 2025/26
A goal in the third minute and a goal in the 93rd both change the score by one. They do not change a team's chance of winning by anything close to the same amount.
To put a number on the difference, we matched the confirmed first goal in every 2025/26 Premier League game to the Bet365 full-time 1X2 price immediately before and after it. After removing the bookmaker margin and filtering out score changes that were later reversed, 347 matches remained. The source was the same tick sequence exposed by the football odds API, not a set of closing-price snapshots.
The headline result: the median first goal added 23.1 percentage points to the scoring team's live win probability. A bootstrap estimate puts the 95% confidence interval for that median at 22.4 to 24.2 points.
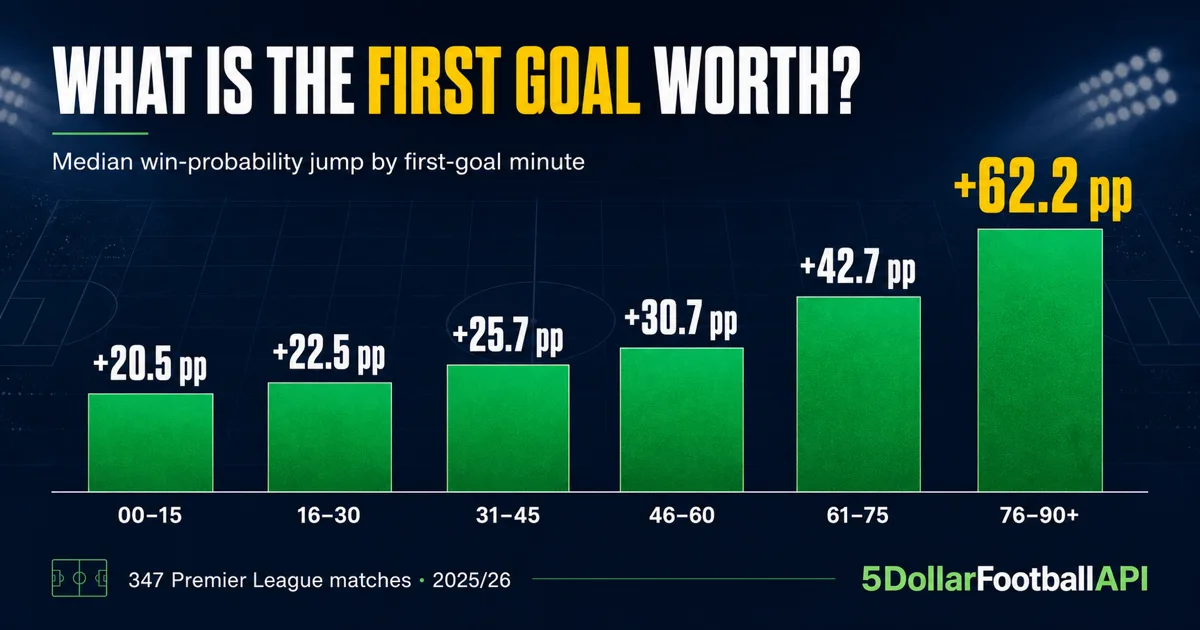
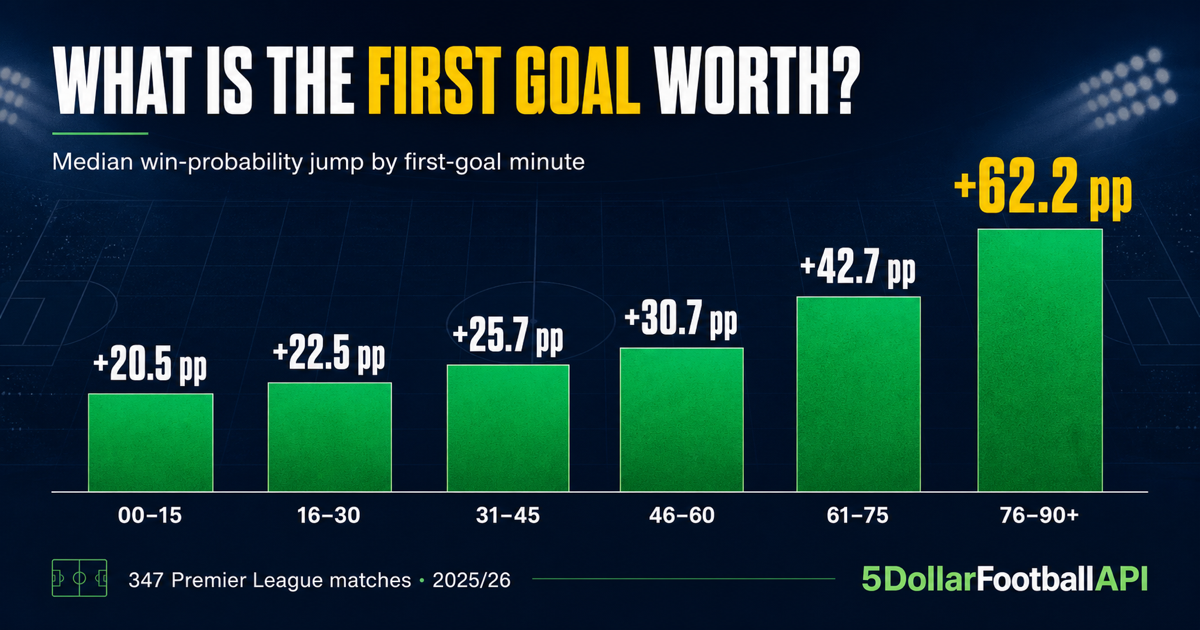
Median normalized win-probability change by first-goal minute. The final bucket contains 17 matches.
This is a market measurement, not a claim that every goal is independently “worth” 23 points. The price already knows who is playing, the score, the minute and how the match has unfolded. The number measures the change around the goal while holding that match context as tight as the feed allows.
The result in five numbers
- 347 confirmed first-goal events analyzed, covering 98.3% of the 353 matches that had a goal
- 23.1 percentage points median within-match increase in the scoring team's normalized win probability
- 40.8% before and 68.0% after for the sample medians
- 1.97× median probability multiplier when the team scoring first had been the underdog
- 64.8% of first-scoring teams went on to win the match
The 40.8% and 68.0% figures are separate sample medians. The 23.1-point headline is calculated within each match first and then summarized, which is the correct way to measure the price change.
A late first goal is worth far more
Time remaining dominates the result. The market has plenty of time to recover from an early goal; a first goal near full time can settle nearly the whole match at once.
| First-goal minute | Matches | Median probability change | Median before | Median after |
|---|---|---|---|---|
| 00–15 | 105 | +20.5 pp | 43.1% | 65.0% |
| 16–30 | 80 | +22.5 pp | 42.3% | 66.5% |
| 31–45 | 76 | +25.7 pp | 40.2% | 66.4% |
| 46–60 | 45 | +30.7 pp | 42.4% | 70.7% |
| 61–75 | 24 | +42.7 pp | 30.7% | 76.9% |
| 76–90+ | 17 | +62.2 pp | 18.8% | 84.4% |
The late-match pattern is large, but the sample is not: only 17 matches had their first confirmed goal after the 75th minute. Treat 62.2 points as a useful description of this season's games, not a universal constant.
The most extreme event was Liverpool's 95th-minute first goal away at Nottingham Forest. Their normalized win probability moved from 4.5% to 96.1%, a 91.6-point jump. That is what “one goal” can mean when almost no time remains.
Underdogs almost doubled their chance
Immediately before each goal, we classified the scoring team by comparing its normalized live win probability with its opponent's. The draw probability was not used for the favorite/underdog label.
| Scoring team before the goal | Matches | Median change | Median before | Median after | Median multiplier |
|---|---|---|---|---|---|
| Favorite | 229 | +22.6 pp | 49.0% | 75.6% | 1.47× |
| Underdog | 111 | +23.7 pp | 25.0% | 49.8% | 1.97× |
The absolute jump was similar: 22.6 points for favorites and 23.7 for underdogs. The relative effect was not. An underdog scoring first moved from roughly one chance in four to almost even money at the sample median.
That distinction matters whenever percentage changes are reported. “Nearly doubled” sounds more dramatic than “added 23.7 percentage points,” but both describe the same underdog group from different angles.
Scoring first was powerful, not decisive
The first-scoring team won 64.8% of the analyzed matches. Favorites that scored first won 69.9%; underdogs that scored first won 54.1%.
Those outcomes are descriptive rather than causal. Strong teams are more likely both to score first and to win, and the live price before the goal already contains much of that information. The useful contribution of the odds data is that it turns “scoring first helps” into a match-specific probability change instead of mixing every game into a raw win rate.
How the measurement works
The source was Bet365 full-time 1X2 tick history for all 380 finished Premier League matches in 2025/26. Every match had valid in-play quotes. Twenty-seven finished 0–0, leaving 353 matches with at least one goal.
For each scoring match, the process was:
- Find the first 1–0 or 0–1 score state that persists in all later ticks, so a briefly displayed goal that is overturned by VAR is not counted.
- Take the last valid 0–0 1X2 quote before that confirmed score change.
- Take the first valid changed quote within 120 seconds after the confirmed score appears.
- Require the before/after quote pair to be no more than 300 seconds apart.
- Convert decimal prices to implied probabilities and normalize the three outcomes so they sum to 100%, removing the bookmaker overround.
- Measure the scoring team's after-minus-before probability change within the match.
The normalization for each home/draw/away quote is deliberately simple:
raw probability = 1 / decimal odds
normalized probability = raw probability / sum(all three raw probabilities)
goal impact = normalized probability after - normalized probability before
That produced 347 usable events. Six scoring matches were excluded because they did not have a sufficiently tight quote pair around the confirmed first goal. The median time between the before and after quotes was 29 seconds, and the longest accepted gap was 292 seconds.
The mean probability increase was 25.9 points, above the 23.1-point median because a small number of late goals created very large jumps. For that reason, the median is the main result. The 95% confidence intervals were calculated with 10,000 bootstrap resamples using a fixed random seed.
You can audit the result in the formatted Excel workbook or download the 347-row match-level CSV. The workbook includes the coverage table, formulas, grouped summaries, method notes and automated quality checks. Every CSV row identifies Bet365 as the bookmaker, 5DollarFootballAPI as the study publisher, and links back to this methodology.
Cite and reuse the dataset
The fixed v1.0.0 research release is archived on Zenodo under DOI 10.5281/zenodo.22115174. The same seven-file release can be browsed on GitHub or explored in the Kaggle Dataset Viewer.
For exact reproducibility, cite the version DOI above. The all-versions DOI is 10.5281/zenodo.22115173. Reuse is governed by the dataset terms, which permit analysis, teaching, editorial citation and non-commercial research with attribution.
Media kit for editors
Journalists, editors and researchers may use the following publication-ready resources. For questions, custom cuts or another chart size, contact [email protected].
Downloads
- Download the publication-ready chart (PNG, 1200×630)
- Download the 347-row match-level CSV
- Download the formatted Excel workbook
- Open the fixed v1.0.0 archive on Zenodo
Three headline findings
- The median first goal added 23.1 percentage points to the scoring team's normalized live win probability (95% bootstrap CI: 22.4–24.2).
- Underdogs that scored first moved from a median 25.0% before the goal to 49.8% after it.
- A first goal after minute 75 produced a median 62.2-point increase, with the important caveat that this group contains only 17 matches.
Method in brief
The study covers 347 usable first-goal events from the 2025/26 Premier League, representing 98.3% of the 353 matches in which a goal was scored. We paired the last valid Bet365 full-time 1X2 quote at 0–0 with the first changed quote after the first confirmed goal, excluded score states later reversed by VAR, and normalized the three implied probabilities to remove the displayed bookmaker margin. This is a descriptive market study, not betting advice.
Suggested citation
5DollarFootballAPI (2026). What Is the First Goal Worth? 2025/26 Premier League (Version 1.0.0) [Data set]. Zenodo. https://doi.org/10.5281/zenodo.22115174
The chart may be republished in editorial coverage with the credit “Source: 5DollarFootballAPI” and a link to this research page. Dataset reuse remains subject to the published dataset terms.
What this analysis cannot say
The study measures one bookmaker's displayed market prices in one league and one season. It does not establish the “true” probability of an outcome, show that a price was available to every customer, or account for stake limits and suspension periods. Goal and price updates can also share the same feed timestamp, so the data should not be used to claim exchange-level repricing latency.
Most importantly, this is not a betting system. The price change happens after the information arrives. It shows how the market valued a goal; it does not offer a way to know the goal in advance.
Why tick history changes the question
A closing snapshot can tell you which team the market preferred before kickoff. It cannot tell you what one event was worth in the 37th or 89th minute. That requires the sequence: quote, score change, quote.
The same method can be applied to equalizers, red cards, penalties and goals scored by ten-man teams. Those are the next questions worth answering because they keep the event fixed while revealing how context changes its market value.
The underlying data for this analysis comes from the odds history endpoint — an Ultra-plan endpoint — which stores the full price path rather than only the latest snapshot. Disclosure: this study was produced by the team behind 5DollarFootballAPI. This research is descriptive, reproducible from the stated rules, and is not betting advice.